
Dashboard tab
The first surface every admin sees after sign-in. Designed to answer "is anything on fire" in five seconds.
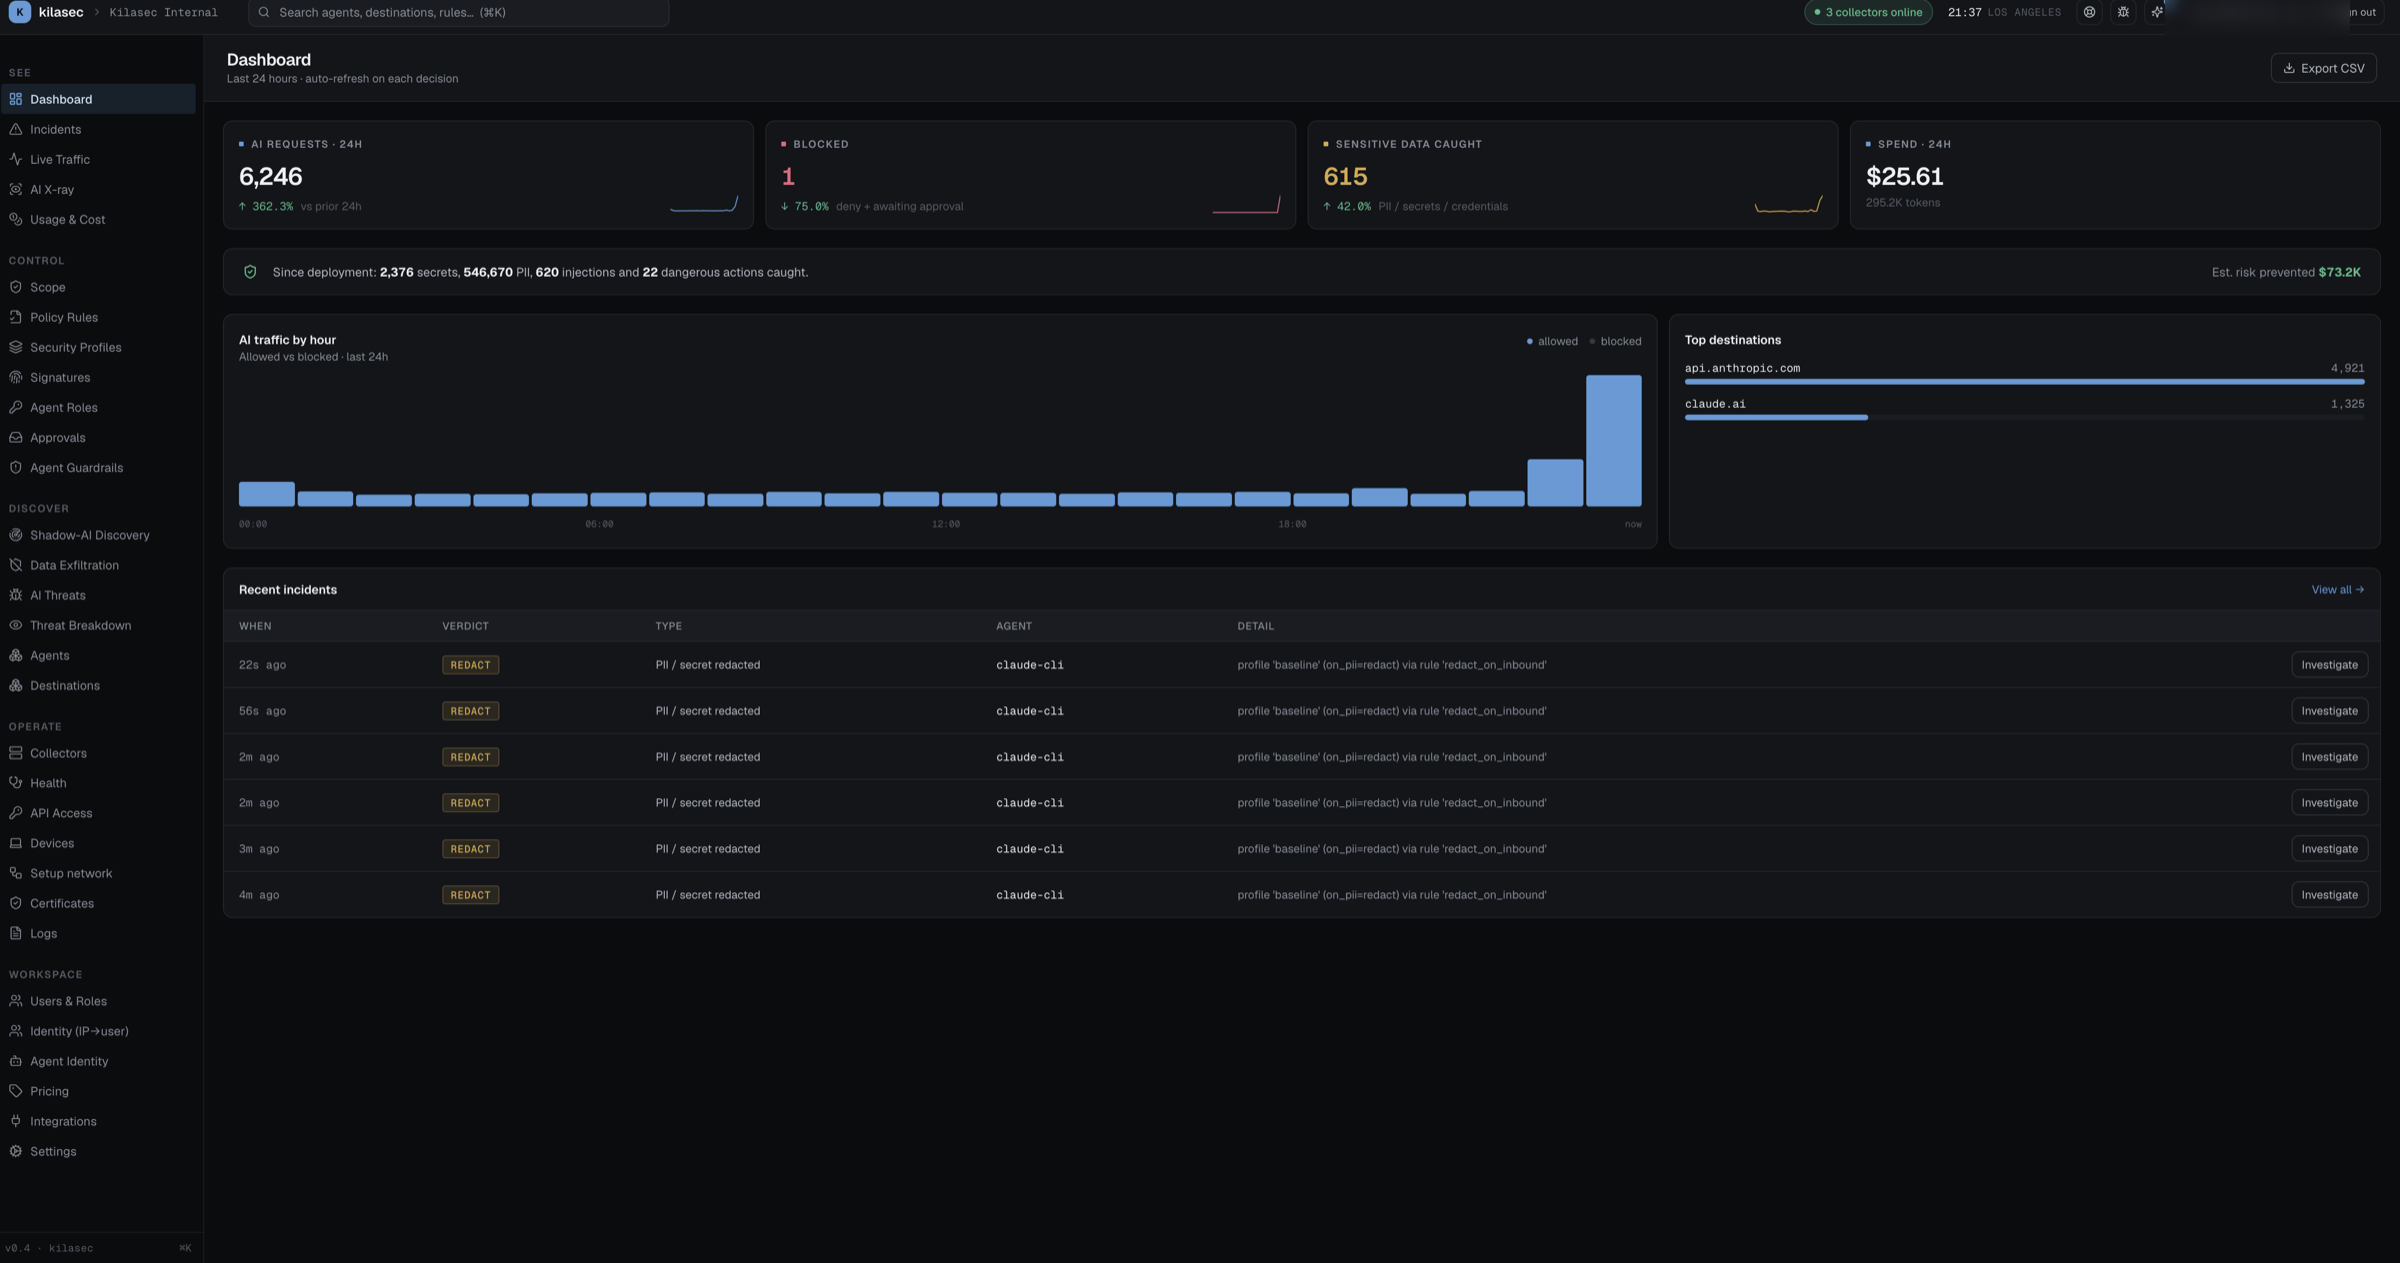
Layout
Four parts, top to bottom:
- Page header — title, "Last 24 hours" sub-line, time-range selector, Export CSV button.
- KPI strip — four cards: AI requests / Blocked / Sensitive data caught / Spend (24h).
- Traffic chart + Top destinations — stacked 24-hour bar chart (blue = allowed, slate = blocked) next to a ranked list of destinations.
- Recent incidents — table of the most recent denies / redacts / awaiting-approvals.
Until the first decision lands, a first-run checklist ("Get your first collector live") also appears above the KPI strip, walking the four setup steps: install a collector, point the network at it, trust the inspection CA, verify traffic.
KPI cards
Each card shows a label, a tabular-numeric value, a delta with arrow + sub-line, and a per-hour sparkline once there's real data.
| Card | Source | Delta meaning |
|---|---|---|
| AI requests · 24h | count of decisions, last 24h | vs. prior 24h |
| Blocked | deny + require_approval, last 24h | vs. prior 24h, red when rising |
| Sensitive data caught | redact count, last 24h | vs. prior 24h |
| Spend (24h) | sum of cost_usd from /principals/summary | no delta — the sub-line shows token volume instead |
Deltas only render when there's a real prior-24h baseline. If you just installed kilasec, no delta is shown for the first day.
When the collector hasn't emitted cost yet (/principals/summary returns cost_usd: 0), the Spend card shows — · no token data yet instead of $0.00. This is the right thing — false zeros are misleading.
Traffic chart
Stacked bars, 24 of them, one per hour. Each bar's height is allow + blocked for that hour; the split is allowed-on-bottom (blue) and blocked-on-top (slate). Axis labels at 00:00 / 06:00 / 12:00 / 18:00 / now.
Empty hours render as 1-pixel minimums so you can see the time dimension even on a quiet network.
Top destinations
Up to six rows. Each shows host · count plus a progress bar (% of top).
The list is updated on every SSE event — the bar widths recompute in real time as new decisions arrive.
Recent incidents
A small table of the most recent six rows where verdict ∈ {deny, redact, require_approval}. Each row has an Investigate button that jumps to Live Traffic.
Export CSV
Clicking Export CSV downloads kilasec-audit-<timestamp>.csv with the currently visible events (whatever's in decisions[] client-side, up to the 2,000-row in-memory cap). For larger windows, use the API directly:
curl -H "Authorization: Bearer $TOKEN" \
  "https://kilasec.com/api/audit/export?format=csv&window=86400" \
  -o audit.csv
Auto-refresh
The page polls real-time. SSE (/api/events) pushes new decisions into the in-memory list; the KPI strip + chart + destination list re-derive on every render. No manual refresh needed — if the connection drops, the stream reconnects automatically and the pill in the top bar shows the state meanwhile.
→ For the dense streaming view, switch to Live Traffic.