
Live Traffic tab
The streaming, dense audit view. Every AI request that came through the firewall, newest first. Click any row to inspect.
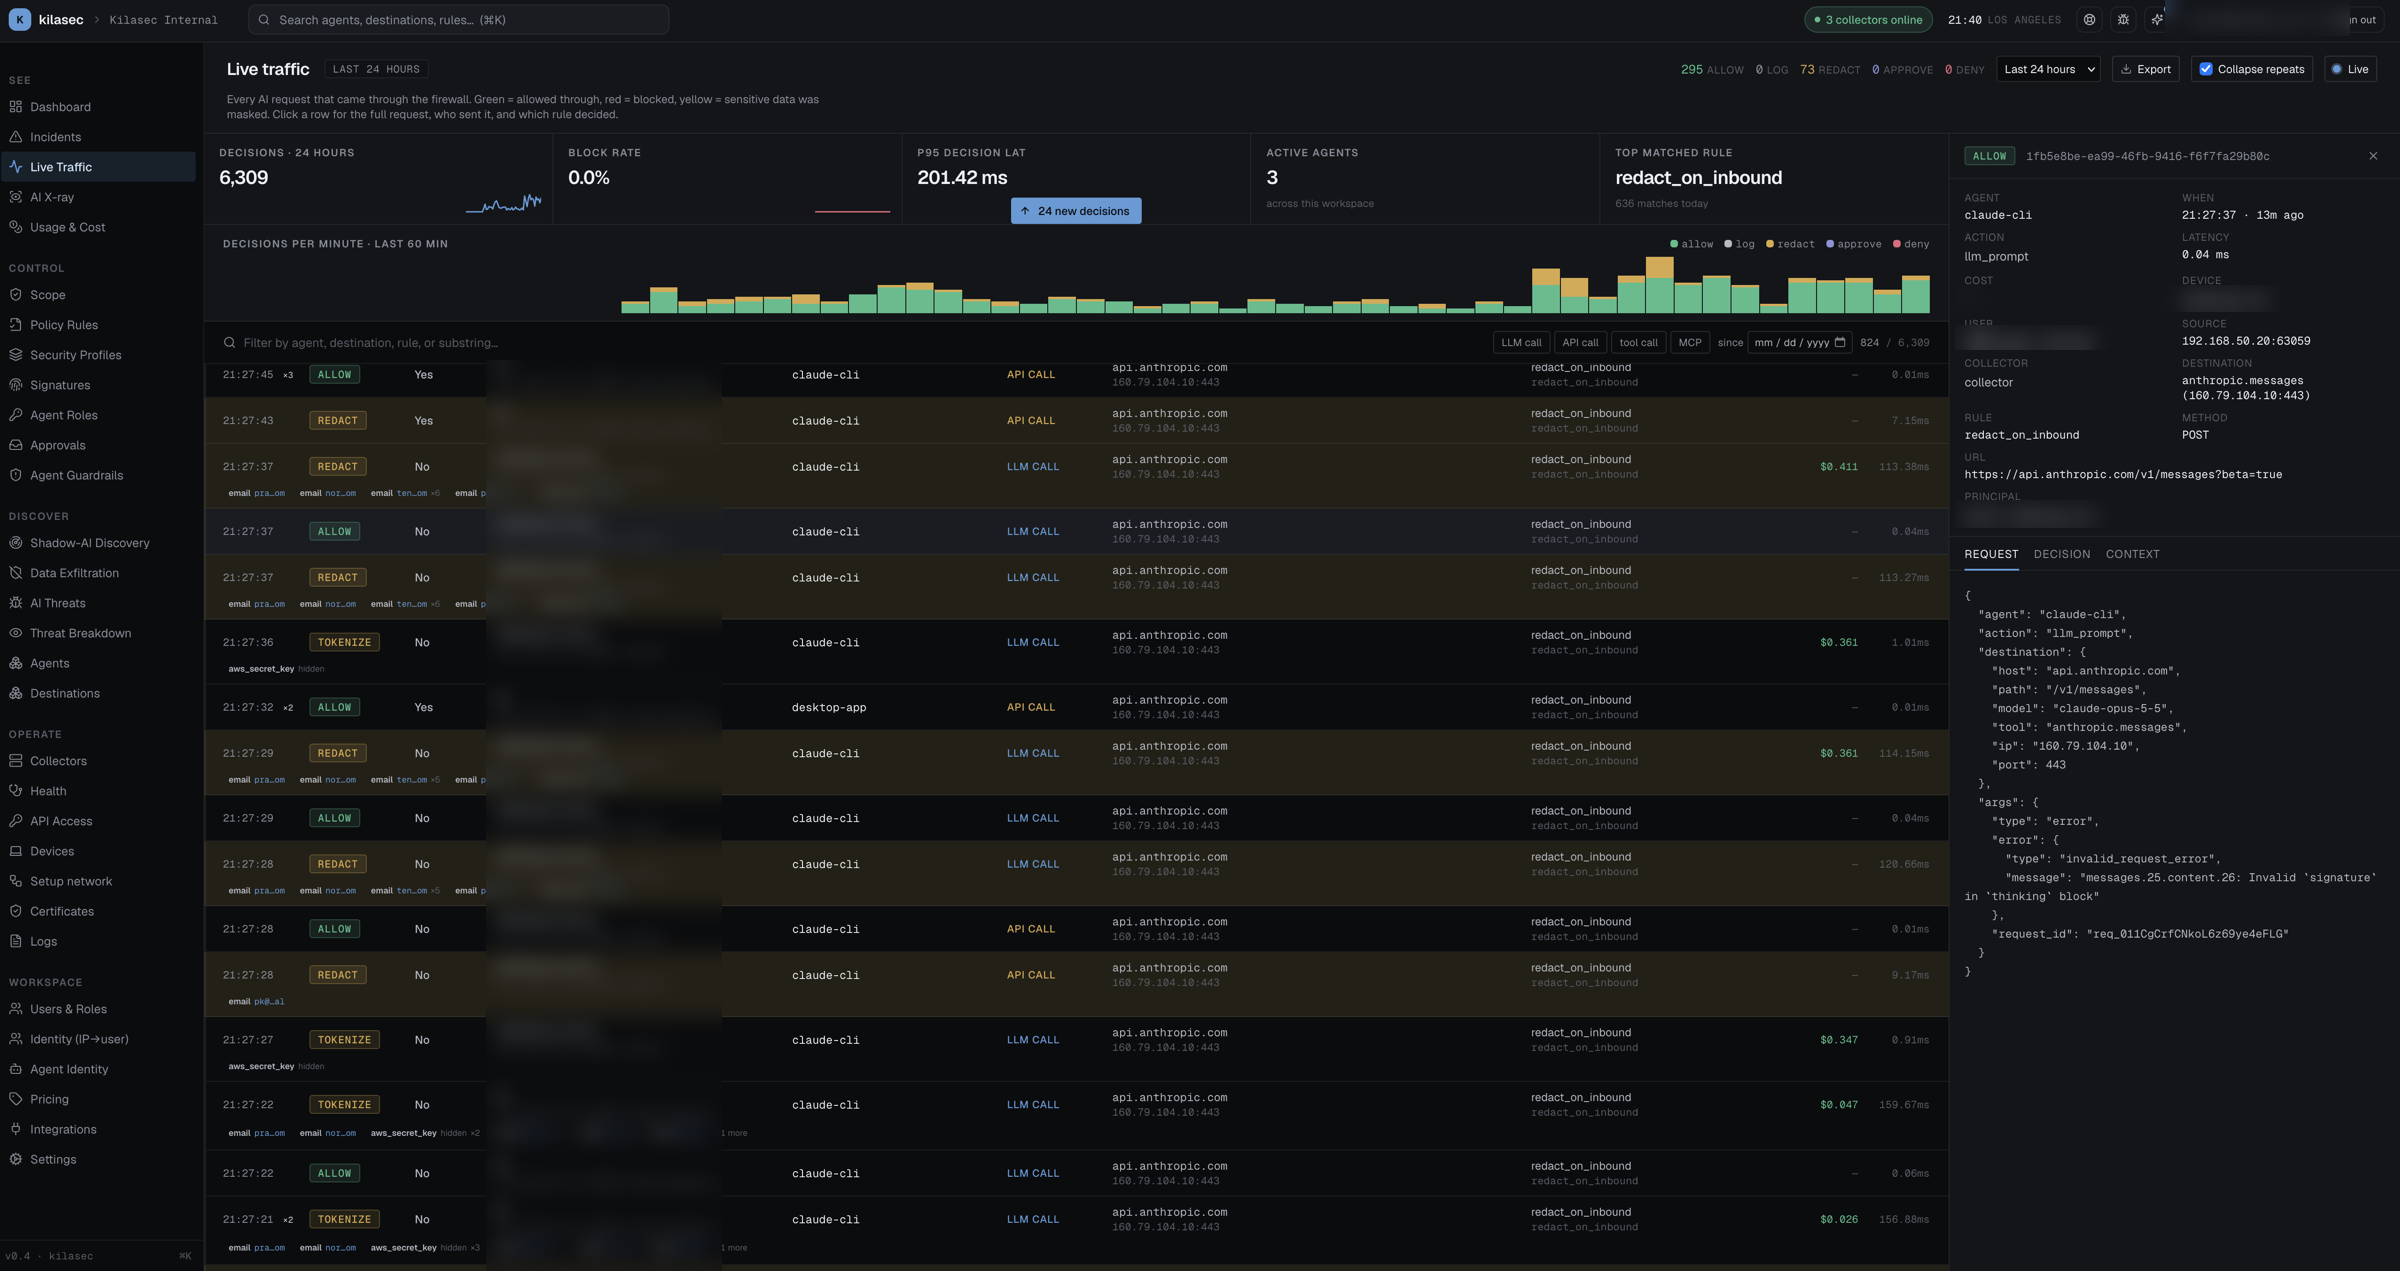
Layout
- Header — title, count-strip of verdicts (allow / log / redact / approve / deny), Live/Paused toggle.
- Metrics strip — 5 KPIs above the table: Decisions / Block rate / p95 latency / Active agents / Top matched rule.
- Decisions-per-minute chart — 60 bars, last 60 minutes, stacked by verdict.
- Filter bar — text search + chip filters (agent / verdict / action / destination / rule).
- Table — Time / Outcome / Source / Agent / Activity / Destination / URL / Rule / Lat. 48 px rows, mono data, sans chrome.
- Drawer (right side, click any row to open) — three tabs: Request / Decision / Context.
Color language
Verdicts use the same palette everywhere in the SPA:
| Verdict | Pill | Row left-edge stripe |
|---|---|---|
allow | green | — |
log | slate | — |
redact | amber | amber tint |
require_approval | cyan | cyan tint |
deny | red | red tint |
Each row leads with an Outcome pill, and blocked/redacted rows get the tinted left-edge stripe so you can scan a long table at a glance. The single-character verdict shorthand (A / L / R / ? / D) appears in the drawer's Context tab.
Live tail
The pulse dot in the header indicates the SSE connection is open. New decisions stream in via /api/events and prepend to the list.
If you scroll down, the list pauses — a small "N new decisions" pill appears at the top so the visible rows don't shove around while you're reading them. Click the pill to flush + scroll back to top.
Keyboard:
L— toggle live tail.Esc— close the drawer.Cmd/Ctrl-K— command palette → "Show denied", "Resume live tail", etc.
Filter chips
The chips are conjunctive — you can stack any combination, and they AND together. Click any agent or destination cell in a row to add it as a chip; verdict chips come from the count strip in the header, and rule chips from the drawer (the rule cell in the table isn't clickable).
Examples:
- "Show me every
denyfromqa-eval-looptoapi.openai.com" → clickdenyin the verdict count strip, click the agent cell on any matching row, click the destination cell. - "Everything not matched by a rule" → search for
no rule matched.
The "shown / total" count next to the search box tells you what fraction of the loaded events the current filter is showing.
The drawer
Click any row → a 480px-wide drawer slides in on the right. A field grid at the top shows agent, when, action, latency, source (IP:port), workload (when the host sensor attributed the flow), destination, rule, method, URL, and principal. Below it, three tabs:
- Request — the full request JSON (agent / action / destination / args).
- Decision — the verdict, matched rule, reason, and (for redact) the list of redacted field names.
- Context — the last 8 decisions from the same agent, in mono — useful for "is this misfire isolated or part of a pattern".
The agent / destination / rule values in the drawer are buttons — clicking them adds the value as a filter chip and brings the drawer to that filtered view.
Forensic columns
In addition to the verdict/agent/rule columns, the Live Traffic table shows:
- Source — the LAN address that originated the request. When the kilasec host sensor (eBPF) attributed the flow, the workload — the actual process or pod behind it — appears under the IP; otherwise the source port does. This is what tells apart co-located agents sharing one IP.
- Collector — the name of the collector that observed the request, shown next to the source IP and in the drawer. The search box matches collector names too, so you can narrow a multi-collector fleet to one site. Rows recorded before this was added, and events pushed with a tenant API token, have no collector name.
These come from request.metadata, filled in by the collector's data plane and the host sensor; the cloud adds the collector name at ingest.
Performance
The live feed holds the newest events in memory — new SSE messages prepend, old ones fall off the bottom. It is not only a tail, though: pick a range (6 hours → 30 days) or an exact since date and the page pages back through history with Load older, pushing filters to the server so a match in unloaded traffic still surfaces. Export the current window to CSV from the header. For anything beyond the retention window, use the API.
When the live tail looks dead
The connection pill in the top bar tells you the truth:
- green "Collector online" (or "N collectors online") — SSE open, collectors heartbeating, new events flowing.
- amber "Connecting…" — EventSource is in retry-with-backoff.
- red "Collector offline" — no collector is heartbeating; "Live feed offline" — the event stream to the cloud is down and the page is showing stale data.
Quiet network, not dead: if the pill is green but no new rows arrive, your network simply isn't sending traffic. Send a synthetic test burst to confirm the path is alive.
→ See Generate test traffic.